In contrast to many other papers published in Frontiers in Plant Science (FiPS) – I like the format and transparency initiative (non-anonymous reviewers) but some papers there (e.g. those on oaks) have serious flaws – the one by Li et al. (2019) is definitely a nice, well-done study, with a very nice sampling, a fine set of analyses and pretty neat figures worth a read. And an unusually (for such kind of studies) large online supplement with only one catch: all supplement files are PDFs and Word docs. Even the tables, which hinders quick access and re-use. Always use spreadsheets for tabulated data. MS Office's proprietary xlsx-files are quite compatible (I love the auto-filter); if you want to make sure, anyone can use it, just opt for comma- or tab-separated files.
The most important thing of any phylogenetic study, the used matrix, is nowhere to be found. An very common industry anti-standard (Why we want to publish our phylogenetic data...), also partly due to the journal policies to only accept certain file formats as online supplementary material (a phylogenetic matrix provided as PDF, image file, or doc, is a no-go).
The background: When plastomes ignore species
Most of the analysis are flawless (as far as I can tell). However, they repeated a common error of all Chinese phylogenetic studies on oaks published in the recent years that used plastid data (marker-based or using complete plastomes).
They discuss and interpret their results without any reference to the two sibling species of Q. chenii, Q. acutissima and Q. variabilis. Which have a much wider distribution ...
 |
| Approximate distribution of subsect. Campylolepides, the East Asian members of sect. Cerris. |
... and all plastid data accumulated so far for oaks (and Fagaceae) have shown the same: poor correlation between species and plastid signatures. Here are two papers, everyone dealing with oak plastid data should have read and digest.
- Neophytou C, Dounavi A, Fink S, Aravanopoulos FA. 2010. Interfertile oaks in an island environment: I. High nuclear genetic differentiation and high degree of chloroplast DNA sharing between Q. alnifolia and Q. coccifera in Cyprus. A multipopulation study. European Journal of Forest Research 130:543–555.
- Neophytou C, Aravanopoulos FA, Fink S, Dounavi A. 2011. Interfertile oaks in an island environment: II. Limited hybridization Quercus alnifolia Poech and Q. coccifera L. in a mixed stand. European Journal of Forest Research 130:623–635.
Just a local example but a well-studied and -documented case and, as far as we can tell, the model for the entire genus: co-occuring, closely related but morphologically distinct species can be differentiated using nuclear data but plastid data, even when showing variation (in the case of the Cypriotic oaks, there are two plastid groups), will ignore the species boundaries.
Side-information: Unsurprisingly, when including data from all over western Eurasia of the other members of sect. Ilex, using the nuclear-encoded 5S-IGS and ITS regions, the Cypriotic Q. alnifolia can be readily distinguished from its siblings of sect. Ilex, Q. aucheri, Q. coccifera (incl. the Cypriotic), and Q. ilex (Denk & Grimm, Taxon, 2010). Plastid-wise, there is some diversity, even a few mutations in coding gene regions and low-divergent spacers, but it completely ignores the species: the Cypriotic Q. coccifera and the endemic Q. alnifolia show what we called the 'WAHEA-type' (Simeone et al., PeerJ, 2016).
The fact that plastome pools are variable within a species but do not sort properly during speciation/reflect phylogenetic split culminates in pretty puzzling incongruences between plastid genealogies on one side and nuclear phylogenies, morphology, fossil record, and likely monophyletic taxa on the other side.
 |
The plastid puzzle called Quercus subgenus Cerris section Cerris
We (Simeone et al., PeerJ, 2018) demonstrated the plastid-ignore-species-phenomenon quite recently for the western Eurasian members of sect. Cerris across their entire geographic and taxonomic breadth (a paper Li et al. cite but either didn't read or had to ignore because it wouldn't fit their narrative, hence a little recapitulation).
 |
| A trnH-psbA haplotype network including all species of sect. Cerris (except Q. chenii) and closely related (plastid-wise) Asian spp. of sect. Ilex (Simeone et al. 2018, fig. 1). Line thickness indicates number of mutations: 1 (thin lines), <5, >5 (thick lines). Quite a puzzle. Note the substantial diversity in the East Asian Cerris species (top-right corner) shared by the two widespread species. |
But, like in their sister lineage, sect. Ilex (Simeone et al. 2016; Vitelli et al., Trend Genet. Genomes, 2017), the plastids are geographically sorted. With some differences in the four distinct evolutionary lineages (as defined by congruent nuclear differentiation patterns and morphology).
 |
| Fig. 2 from Simeone et al. (2018). The 5S-IGS clusters are linked to distinct species groups (well correlated with morphology), evolutionary lineages within sect. Cerris |
A general feat in Fagaceae and Fagales when studied with proper sampling (e.g. Cannon & Manos, J. Biogeogr., 2003, for Castanopsis-Lithocarpus; Acosta & Premoli, Mol. Phyl. Evol., 2010; Premoli et al., New Phytol., 2012 for the Nothofagaceae Nothofagus s.str.)
Similar studies are missing for China/East Asia so far but a paper searching for barcodes published not so long ago in the very same journal than the Li et al. study (Yang et al., Front. Plant Sci., 2017) confirms that the Chinese spp. share their plastid haplotypes, too. To a degree that it even disturbed the otherwise pretty clear signal from the nuclear-encoded ITS region, they included as well.
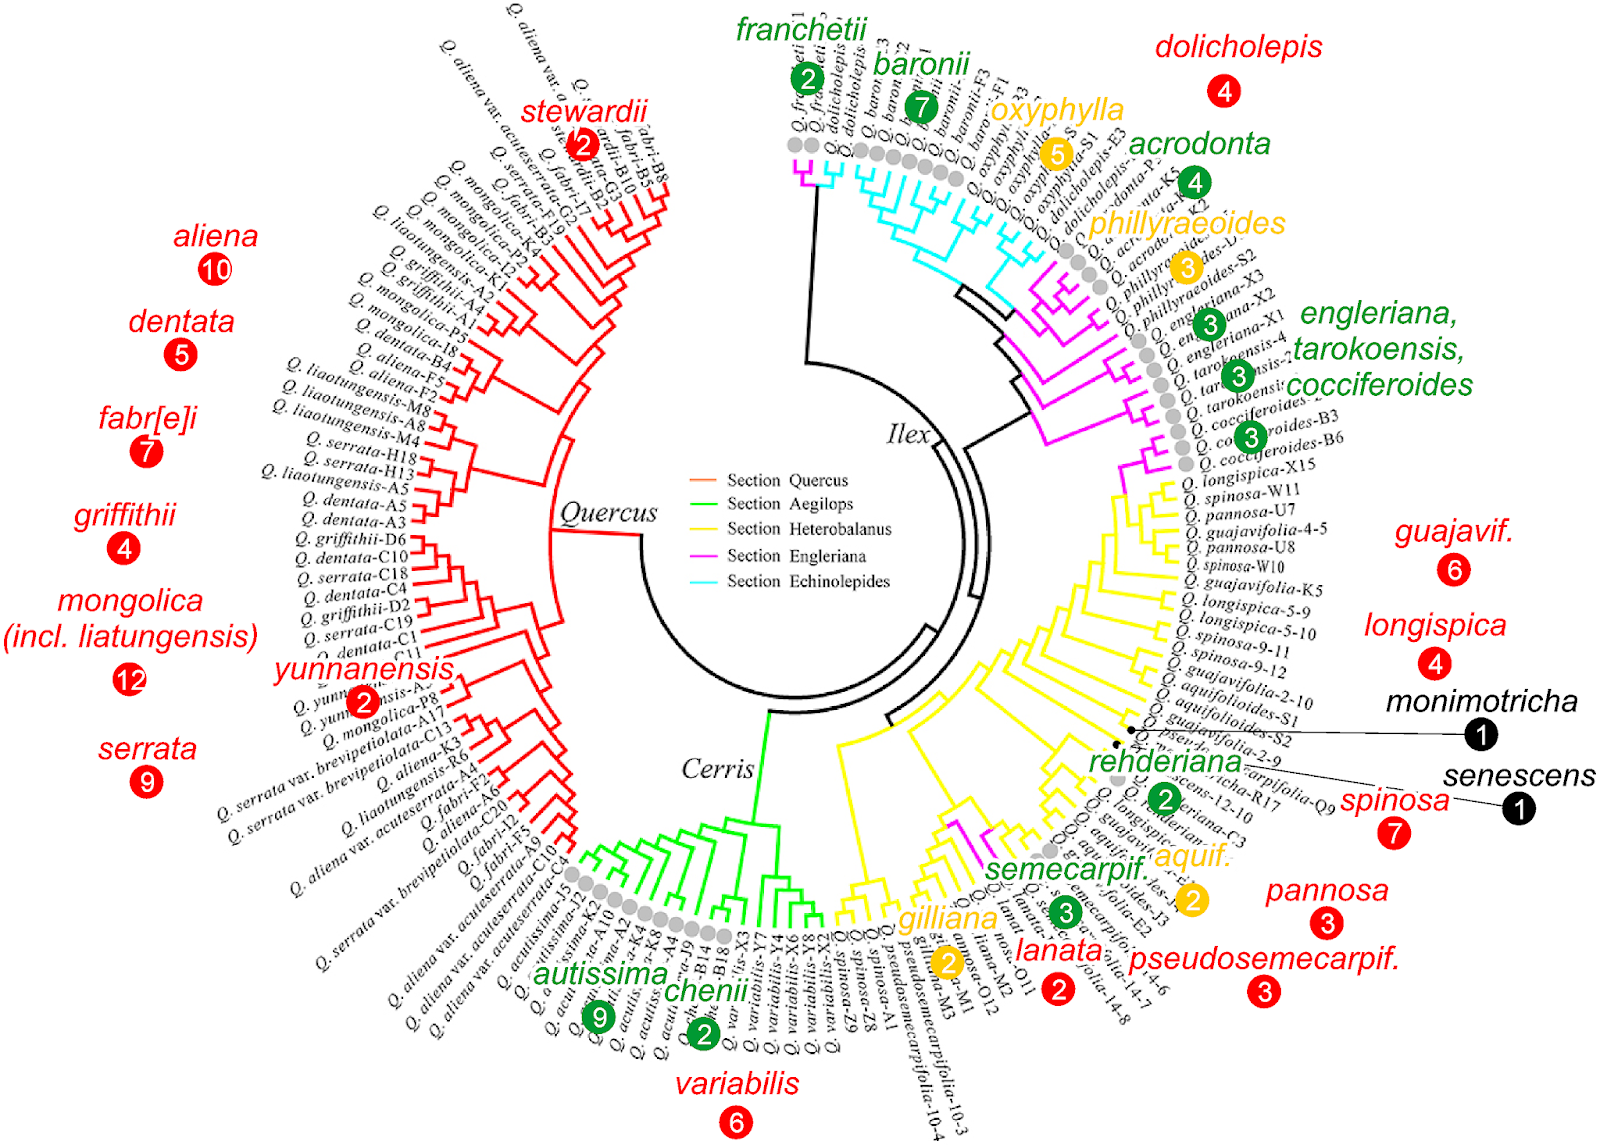 |
| Always a bad idea to combine nuclear and plastid markers following disparate evolutionary pathways, especially when you want to test for barcoding potential. The differention in sects. Cerris, Ilex and Quercus is, however, genuine (note that the forth Chinese oak section, Cylclobalanopsis is missing, their plastid signature would have messed up the Ilex subtree). That some species a part of an exclusive subtree, are coherent (green) in the Cerris and Ilex clades is mainly due to their ITS signals, outcompeting more faible plastid signals; for the non-coherent species (red) in these two clades, the five plastid markers outcompete the ITS, being the most divergent of all included seven markers (modified after Yang et al. 2017, fig. 3). PS It's long known that ITS cannot differentiate between white oaks (sect. Quercus), Chinese or other. |
The same, no species coherence, can be seen in the all-Fagales plastid tree by Xiang et al. (Persp. Plant Ecol. Syst., 2014) but the latter used an uncurated gene bank harvest and traditional plastid barcodes (protein-coding rbcL and matK genes, noncoding trnL/LF region and atpB-rbcL spacer). "Barcodes" that are low-divergent to invarible at genus level and below (and sometimes above) in Fagales in general, and Fagaceae in particular (which is funny, 'cause they use these few but noisy mutations to draw conclusions about diversification rates from root to leaves of their all-Fagales tree; fancy methodology, sophisticated meta-analayses always compensate for poor data when it comes to publishing).
When species share haplotypes, one cannot treat each one as an independent evolutionary unit, one needs to consider the entire species complex. And when it comes to evolutionary trajectories overlapping with the biogeographic ones, one needs nuclear data!
Given the data situation, it's a fair call that any reviewer rejects any paper on oaks that only use plastid data and aims to infer evolutionary relationships in oaks.
But there are two questions for any oak plastid data set, worth exploring.
- Do all species of the sharing lineages show the same geographic sorting?
- Are there species/populations carrying a wrong plastid (i.e. from another region, another lineage)?
Regarding barcoding: Yang et al. euphemistically pointed out that "The highest species discrimination rate (84.85%) was found using the combination of psbA-trnH + matK-trnK + matK + ycf1 + ITS + SAP with the character-based method, which seems to be the best choice for barcoding the Chinese oaks." Species discrimination using individual marker sequences maybe possible with adding 5S-IGS to the ITS and single-copy nuclear marker, but the plastid markers simply don't, as I'll show using the example of the three Cerris species. Which seem to perform quite well given the tree above, if it was not for a single accession of Q. variabilis (percentages are tricky things, when the sample number is low and unequal). Knowing my ITS, I guess they either misidentified the sample (in case the ITS is a chenii-ITS, and chenii-ITS are unique), or the individual has a variabilis-ITS but a plastid signature 100%-identical to that of the sampled chenii. Like Li et al., Yang et al. don't provide their matrix, so there is no easy way to check this out.
The lost (dropped?) data
In 2012, Chen et al. (PLoS ONE) did a similar study on Q. acutissima; Zhang et al. (Biochem. Syst. Ecol. 2015) did (P. R.) Chinese Q. variabilis, you find their trnH-psbA data in our 2018 haplotype network. In the Material & Methods (M&M), Li et al. refer to the also very well sampled Zhang et al. (2015) study as reference for their experimental set-up: "Four chloroplast intergenic spacers, atpB-rbcL, psbA-trnH, trnS(GCU)-trnG(UCC), and trnS(GCU)-trnT(GGU), were sequenced for six to ten individuals per population following protocols in Zhang et al. (2015)." But instead of considering any data from that study (or the one by Chen et al.), they used "haplotype F and A [to] represent outgroups, Q. fabr[e]i and Q. aliena, respectively". East Asian white oaks (subg. Quercus sect. Quercus), most distant relatives within the genus! Usually, for a species close-up, you'd take the closest relatives, the sister lineages/species as outgroup. Pretty easy to pick.
 |
| There's more than one candidate for suitable outgroups for sect. Cerris but an easy pick would be Q. baronii of sect. Ilex. |
Given what all earlier studies showed and indicated (intra-specific variation > inter-specific differentiation), wouldn't one need to know how the chenii-haplotypes and plastid diversification relates to the patterns already established for Q. acutissima and Q. variabilis? There are only three species of sect. Cerris in East Asia, it would have been time to wrap up! Especially since Q. chenii only occurs in the 'heartland' of the other two.
But, using a proper outgroup would have directed the reader to the fundametnal problem of Li et al.'s study. What can we say about intra-species differentiation when our data don't discriminate between species?
Curious for the missing data (and knowing my foe, oak data), I harvested the plastid sequence data available for the three East Asian species of sect. Cerris to look at an alignment of the probably most variable intergenic spacer in their data set, the trnH-psbA (and a few others with a score of accessions). And always curious about what complete plastome data actually can provide (given how poorly documented the provenance of the sequenced material is in many cases, last week I had my first chance to review one of these necessary, potentially very valuable but badly conceived papers submitted to PeerJ), I added the data from the five complete plastome sequences.
Here's the bird's eye view for the trnH-psbA intergenic spacer.

There seems to be no exclusive trnH-psbA haplotype for any of the three species. I'm not sure whether Li et al.'s full data has been released yet (there are no accession numbers provided in M&M) but there are 20 accessions of Q. chenii, six associated with Yang et al. (2017), two with a paper by Yan et al. (2018, FiPS, 9, 569) and some newer ones referred to as "Li,Y., Zhang,X., Sork,V.L. and Fang,Y., unpublished" (accession nos. MH924181–MH924191), which could well be the ones from Li et al. (it's common, although not ideal, to only upload representative sequences to gene bank, gene banks are not too keen on storing huge amount of literal duplicates; providing the used NEXUS-file with labels linked to the voucher/locality tables, is an easy fix to this problem).
The only chenii-exclusive features are a 32 nt-long inversion at the 3' end found in two Q. chenii accessions (MH058988, MH058989) and a transversion in two others (MH924184, MH924187), which are, otherwise, showing the consensus sequence. Any other derivation from the consensus of all East Asian sect. Cerris spp. can be found in either Q. acutissima and/or Q. variabilis accessions. Indels (here duplications and deletions) are rare and scattered (Li et al. used the software Gapcoder) but account for most of the intra-sectional divergence.
 |
| A (full) median-network for the trnH-psbA of East Asian Cerris oaks. Mutational events include point mutations (Ts. – transitions; Tv. – transversions), indels (Dupl. – duplications, Del. – deletions, Ins. – insertion), inversions, and minute sequence modifications (Mod.) in C- or T-dominated oligonucleotide motives. |
The other gene regions I looked up are showing the same. There is some variation in the plastid gene pool of East Asian Cerris oaks, maybe even an emerging structure, but it's not species-specific.
Gene/intron portions like e.g. the trnK/matK regions (included by Yang et al. 2017 but not Li et al.) are essentially invariable, pitted with few mutations at 3rd codon positions in a few accessions (there may be a lesson to learn here for analysing complete plastomes, though). The ycf1, a long protein-coding gene increasingly popping up in barcoding studies and according to a most recent complete plastome analysis "an optimal genetic marker" (Liu et al., Forests, 2019), is no exception (again fragments sequenced showing a bit variation, 100%-identical in the complete plastomes)
Notable side-observation – Although the complete plastomes cover all three species, they are not only very much alike but typically show the unmodified consensus sequence. Obviously, the complete plastomes only capture a tiny fraction of the actual plastid divergence in East Asian members of sect. Cerris. And this is probably true for the entire genus, and the reason why you won't find a single reference to/ comparison with single- and oligo-gene marker data in any of the (all Chinese so far) complete oak plastome papers but a lot of general blabla about "higher resolution" and "potential" to resolve oak phylogenetics. You only get finely resolved trees because one just takes a single individual per species, and what they find as infra-sectional "relationships" is geographic differentiation at best and stochastic noise at worst with no relevance whatsover regarding taxonomy, systematic, speciation or intra-sectional evolutionary relationships (something editors and reviewers of these papers are entirely ignorant about).
What can we learn from Li et al. (and the data, they ignored)
Like their western Eurasian relatives, the East Asians are a species-ignorant lot when it comes to their plastid differentiation. And their plastid diversification is equally complex, nothing trees can handle (Li et al. base much of their interpretation on a misinformed molecular dating).
The patterns Li et al. found may nevertheless relate to what they discuss. But it's not just intraspecific diversification (population-processes). What we look at is the result of an obviously non-homogenous ancestral plastid gene pool predating the formation/stabilisation of the modern species and picking up or losing imprints along the individual history of the composing species of section Cerris in East Asia while evolving very little (or slowly).
Something one may have been able to elucidate when one would have put their data into a necessary perspective by adding it to the data of Shen et al. and Zhang et al. Any reviewer with insights on oaks should have pointed that out. So either those of Li et al. had no idea about oaks, decided to not speak up for political reasons, or their comments were ignored during review.
A history that notably goes a long way back, the oldest Cerris fossils are from this part of the world and of Oligocene age.
And far beyond the border of the People's Republic of China. Plants bother very little about human politics. Q. chenii is endemic to China but the other two carrying the same plastomes, are not. And only China has the money and research workforce to do the unprofitable stuff, like sequencing complete oak plastomes and screening plastid markers.
 |
| Back in 2012, Chinese researchers had still international connections: the chloroplast haplotype map for the first of the three species of section Cerris analysed (Chen et al., 2012, fig. 1). Note the homogeneity in the island populations. Zhang et al. (2015) studying the second, even more widespread species, kept themselves to the People's Republic. Li et al. (2019) don't even cite the paper (don't wake the sleeping peer dogs). A clear case of scientific regress, more data, less awareness. |
There would be a lot to find when one would start from the actual situation.
- Plastid haplotypes are not species-diagnostic (and this will not change with complete plastomes at hand), and
- there are some deep clashes with the likely backbone phylogeny (nuclear-based trees and data agree sometimes freightingly well with morphology and the fossil record), the nucleome evolves in course of the phylogenetic unfolding, the plastome is just carried along.
When you want to study oak phylogeny or test/refine systematic and taxonomic concepts, you need nuclear data!
When studied in the proper conceptual framework, plastid data has enormous potential for oak evolutionary and especially biogeographic, studies. Chloroplast genomes are only maternally inherited in oaks and most other (flowering) plants, so they have the potential to conserve signals from early messing up in oaks that may be homogenised away in nuclear data sets. The fact that the plastid signatures show a strong geographic correlation and are slow-evolving is a boon! Oak species may be one reason why already Darwin disregarded what later would become the biological, phylogenetic, or cladistic species concepts: a species is not a fixed and stable unit, it has only a practical purpose not a theoretical. They come and go. And more often than we would like to, they just fuse or mingle. But when inbreeding outcompetes outbreeding, biparentally inherited genetic markes (and morphologies) have a good chance to be homogenised and sorted (Hipp et al., Ann. MO Bot. Garden, 2019). Oak seeds, on the other side, do not travel far in general and carry along their local plastid signatures. With a bit of luck, like in the western-most populations of Q. ilex, signatures that point towards something lost in the clouds of time.
The historical perspective, however, brings us to Li et al.'s flawed (still very common) molecular dating, but this has to wait till a later post as it tackles commonly found problems in oak, Fagaceae and Fagales dating literature (the main points are included in my online comment to the Li et al. paper).
Oaks need global-thinking Chinese researchers
Oak plastid data are non-trivial and unpromising for western researchers who struggle hard for research money (and need high-impact papers), and even more so, work force. It's no co-incidence that all complete plastomes sequenced so far are from Chinese species and work-groups and only a single complete plastome covers the entire rest of the world.
Only by pulling together German (DFG) and Swedish (VR) money and resources (and a bit of ingenuity; all my papers till 2010 were only possible thanks to my DFG-funded, highly experienced, full-time late technician, the magical Karin Stögerer, but without VR-funds of my friend and colleague Thomas Denk in Stockholm, we couldn't have sequenced the big lot) and, more recently, Italian passion, contacts and (partly underpaid) workforce (Simeone et al. 2016, 2018, Vitelli et al. 2017), we did what we could afford for the western Eurasian oaks.
But we know very little about plastid differentiation in New World oaks. Maybe it's much less interesting than in Eurasia with its much more challenging palaeogeographical/-topographical history. Nonetheless, most oak species are found across the sea.
In China, the work/money situation is much better. They have plenty young and clever people to handle any fancy analysis software. However, so far, they often (not always!) publish with little idea what to look and watch out for, largely following standard procedures and ignoring inconvenient data/phenomena. This will not fill any of the many gaps in knowledge (although even properly peer-reviewed journals will eventually publish anything, no matter how wrong, see e.g. this recent example using complete plastome data of Betulaceae, for many reasons including non-scientifical ones).
When you like oaks, next time you join the same conferences (Blogger is a Google service), get into touch and start to co-operate. And, as always, share your data with the world!
Because the senior researchers controlling the Chinese oak research market seem to share a simple agenda: ignore everything, learn nothing. And the (too) many scientific outlets lack obviously the infrastructure and expertise to clean out even the most obvious errors and shortcomings.
PS The trnH-psbA, trnK/matK, and ycf1 alignments and haplotyping table(s) for the three East Asian species of sect. Cerris are included in this figshare file collection, which will, bit by bit, collect all other matrices from my oak genebank harvests/ relevant to my oak-related posts.
Mentioned literature
- Acosta MC, Premoli AC. 2010. Evidence of chloroplast capture in South American Nothofagus (subgenus Nothofagus, Nothofagaceae). Molecular Phylogenetics and Evolution 54:235–242. —a must read for anyone analysing plastid data on Fagales.
- Cannon CH, Manos PS. 2003. Phylogeography of the Southeast Asian stone oaks (Lithocarpus). Journal of Biogeography 30:211-226. —introducing a widespread haplotype shared by Castanopsis and Lithocarpus.
- Chen D, Zhang X, Kang H, Sun X, Yin S, Du H, Yamanaka N, Gapare W, Wu HX, Liu C. 2012. Phylogeography of Quercus variabilis based on chloroplast DNA Sequence in East Asia: Multiple glacial refugia and mainland-migrated island populations. PLoS ONE 7:e47268. —possibly still the best of all three studies dealing with East Asian Cerris oaks, surely the most comprehensive. For some reason neither Zhang et al. (2015) nor Li et al. (2019) found it relevant for their studies.
- Denk T, Grimm GW. 2010. The oaks of western Eurasia: traditional classifications and evidence from two nuclear markers. Taxon 59:351–366. —includes a world-ITS tree already showing that ITS is useless for most of the 'New World' oaks of what later would become subgenus Quercus.
- Hipp AL, Whittemore AT, Garner M, Hahn M, Fitzek E, Guichoux E, Cavender-Bares J, Gugger PF, Manos PS, Pearse IS, Cannon CH. 2019. Genomic identity of white oak species in an eastern North American syngameon. Annals of the Missouri Botanical Garden 104:455–477.
- Li X, Li Y, Zang M, Li M, Fang Y. 2018. Complete chloroplast genome sequence and phylogenetic analysis of Quercus acutissima. International Journal of Molecular Sciences 19:2443. —a technical report describing the newly assembled plastome, and a funny little cladogram (an accessory of many such reports).
- Li Y, Zhang X, Fang Y. 2019. Landscape features and climatic forces shape the genetic structure and evolutionary history of an oak species (Quercus chenii) in East China. Frontiers in Plant Science doi:10.3389/fpls.2019.01060.
- Liu X, Chang E-M, Liu J-F, Huang Y-N, Wang Y, Ning Y, Jiang Z-P. 2018. Complete chloroplast genome sequence and phylogenetic analysis of Quercus bawanglingensis Huang, Li et Xing, a vulnerable oak tree in China. Forests 10:587. —like Li et al. (2018) but with more taxa in the cladogram (the sequenced microspecies is also taxonomically vulnerable).
- Manos PS, Cannon CH, Oh S-H. 2008. Phylogenetic relationships and taxonomic status of the paleoendemic Fagaceae of Western North America: recognition of a new genus, Notholithocarpus. Madroño 55:181–190. —shows the only valid published combined nuclear-plastid Fagaceae tree.
- Premoli AC, Mathiasen P, Acosta MC, Ramos VA. 2012. Phylogeographically concordant chloroplast DNA divergence in sympatric Nothofagus s.s. How deep can it be? New Phytologist 193:261–275. —the second must-read.
- Simeone MC, Grimm GW, Papini A, Vessella F, Cardoni S, Tordoni E, Piredda R, Franc A, Denk T. 2016. Plastome data reveal multiple geographic origins of Quercus Group Ilex. PeerJ 4:e1897. —see title, and then check out the currently popping up "much better" complete plastome trees on oaks.
- Simeone MC, Cardoni S, Piredda R, Imperatori F, Avishai M, Grimm GW, Denk T. 2018. Comparative systematics and phylogeography of Quercus Section Cerris in western Eurasia: inferences from plastid and nuclear DNA variation. PeerJ 6:e5793. —just the rocky tip of the iceberg.
- Vitelli M, Vessella F, Cardoni S, Pollegioni P, Denk T, Grimm GW, Simeone MC. 2017. Phylogeographic structuring of plastome diversity in Mediterranean oaks (Quercus Group Ilex, Fagaceae). Tree Genetics and Genomes 13:3 [e-Pub]. —I still love it. Just check out the figures, if you have no time to read (again, tip of the iceberg).
- Yang J, Vázquez L, Chen X, Li H, Zhang H, Liu Z, Zhao G. 2017. Development of chloroplast and nuclear DNA Markers for Chinese oaks (Quercus Subgenus Quercus) and assessment of their utility as DNA barcodes. Frontiers in Plant Science doi:10.3389/fpls.2017.00816. —There is so far no chloroplast marker with barcoding utility below the section level (the authors should have done a comprehensive phylogenetic analysis of their matrix rather than fishing for the unfishable).
- Xiang X-G, Wang W, Li R-Q, Lin L, Liu Y, Zhou Z-K, Li Z-Y, Chen Z-D. 2014. Large-scale phylogenetic analyses reveal fagalean diversification promoted by the interplay of diaspores and environments in the Paleogene. Perspectives in Plant Ecology, Evolution and Systematics 16:101–110. —very ambitious and well-done study with only one little flaw: the used data (PS Xing et al., Evolution, 2014, same thing: fancy analysis, poor data control)
- Zhang X, Lia Y, Li C, Xia T, Zhang Q, Fang Y. 2015. Phylogeography of the temperate tree species Quercus acutissima in China: Inferences from chloroplast DNA variations. Biochemical Systematics and Ecology 63:190–197. —paywalled, figure 1 seems oddly familiar with that of Chen et al. three years earlier and Li et al. four years later, the data shows no difference to that of variabilis by Chen et al.
No comments:
Post a Comment
Enter your comment ...