The reason, my eye turned to the recently published, mostly phylogenomic papers on maples (Acer, Sapindaceae), is because they pissed me off. For several reasons.
Complete plastomes: more nucleotides + less samples = higher support ≠ better phylogenies
While the abstracts of the new papers are either painfully boring or overbording with (not really) “new” insights, many aspects of these supposedly better phylogenies – based on phylogenomic data, not “fragments” – were oddly familiar to my eye. But obviously not to the editors and reviewers involved (or heard) in (during) the review process. So, you can read in a top-quartile (Q1) journal something like:
In phylogenetic analysis, we have reconfirmed that Acer pictum subsp. mono and A. truncatum as sister species. Our results strongly support the sister relationships between sections Platanoidea and Macrantha and between sections Trifoliata and Pentaphylla. Moreover, series Glabra and Arguta are proposed to promote to the section level.—Yu et al. (2022), Trends in Genetics, Journal Impact Factor (JIF) 2021/2022 = 4.3; i.e. Q1-journal, one that counts; literal quote [PS Not a native speaker myself, I always appreciated the English proof-reading back in the days, even when it sometimes struck me as picky.]
Let's see:
Top-result #1: “Reconfirmed” sister relationship of A. mono and A. truncatum? Morphologically trivial (cf. van Gelderen et al. 1994), already ITS-wise obvious, see e.g. Grimm et al. (2006, an literature cited and discussed therein) using 606 ITS clones capturing interspecific divergence to intragenomic variability, and Grimm & Denk (2014) focussing on A. campestre using more data on the corresponding section Platanoidea. Not to mention the first molecular phylogenetic trees for Acer [see refs in my 2003 Ph.D. thesis; online, green open access, since 2005]. The type species of the A. mono-complex, A. pictum, is Japanese; a lot of interesting A. mono populations grow on the soil of the P.R.C's neighbours. To properly “reconfirm” a sister relationship, invoking reciprocal holophyly, one should assess the geographic diversity across the species-complex range and their disparity to most-remote siblings. But half of the species of this section are western Eurasian (i.e. occurring west of the Himalayas and Qinghai-Tibetan Plateau), hence (naturally?!) not covered in a P.R.C.-funded, -edited, and -reviewed study (see also Yu et al. 2020 focussing on the section including a single Western Eurasian but not even the only Japanese species: the new #1 in global science, is pretty self-centred when it comes to plants). When P.R.C. researchers don't ignore earlier beyond-China results, and give it a close look, they find that A. mono and A. truncatum are not discrete sister species, but form a diverse genetic and morphological continuum, a hybrid zone, already in northern China (Yang et al. 2022)*. Naturally, if you only include one representative per species, the members of such a species aggregate (or ‘syngameon’), will come out as unambiguously supported “sister taxa”.
Top-result #2: Sister relationship between section Platanoidea and Macrantha? Old hat, especially when using cpDNA data (Renner et al. 2007, 2008). However, rejected with unambiguous support two years earlier (Li et al. 2019, a P.R.C.-based Q1-journal, Yu et al. somehow missed): in both Li et al.'s (2019) concatenated data maximum likelihood (ML) and Bayesian (BI) tree and multi-species coalescent tree (MSC, using ASTRAL), sect. Macrantha is placed as sister to all sections of Acer except those we (Grimm et al. 2006) included in the ‘palmatoid cluster’ (sects Arguta, Cissifolia, Palmata), and with unambiguous branch support. Already the ITS sequences of Macrantha spp. have different affinities within what we called the ‘platanoid cluster’. We identified two main ITS clades within sect. Macrantha (apparently confirmed by Li et al. 2019 using “500 nuclear loci”, labelled as sers Micrantha and Crataegifolia within their sect. Macrantha clade). The nucleomes place the Macranthae close to the root of the Acer tree (Li et al. 2019), as an ancient, possibly low-evolved lineage, in contrast to the strongly evolved and sorted sect. Platanoidea (Grimm et al. 2006; see also Grimm & Denk 2014; Searching for a research object? Why not maples!). How can they share the same plastome lineage? Notably, the plastid Macrantha-Platanoidea clade only includes a single extant species outside Eurasia: an eastern North American species with an Eurasian plastome: A. pensylvanicum. Something unique in the genus: all other plastomes show a deep ‘Old World | New World’ split (Renner et al. 2008). Hence, a direct indication (nucleome-wise A. pensylvanicum is highly similar to its East Asian sisters) for a recent dispersal across either Beringia or the NALB—the North Atlantic Land Bridge. Their shared ‘A plastomes’ (cf. Renner et al. 2008) are a biogeographic legacy (same region of origin) from before the modern lineages manifested and stabilised, but don't reflect a sister relationship in an evolutionary, let alone cladistic, sense. Based on the nucleotide motives in high-divergent, length-polymorphic regions of the ITS, one could hypothesized that the North American (hence, not included in Yu et al. 2022) monotypic sect. Macrophylla is the sister lineage of sect. Platanoidea (Grimm 2003; Grimm et al. 2006); a hypothesis unambiguously supported by Li et al.'s (2019) ML/BI and MSC trees.
Top 3: Trifoliata-Pentaphylla clade? The only high-supported intersectional relationship in our 2006 ITS paper and recovered using plastid data (Renner et al. 2007, 2008; ‘C plastomes’). Recently reconfirmed (as well) using nuclear-phylogenomic data (Li et al. 2019). Funningly, Yu et al.'s tree has no clade collecting exclusively their Trifoliatae and Pentaphyllae. In fact, three Pentaphyllae are nested deep in the Palmata clade, while a Palmata species but also an unrelated Cissifolia species (both species included and grouping as-fit in our 2007 and 2008 trees) fall in Yu et al.'s Trifoliata-Pentaphylla clade. A classic of Q1-papers with compromised peer-review: internal semantic conflict between abstract/ conclusions and results/ discussion, relating to poor taxonomic control on the authors' and editor's/reviewers' side!
Top 4: Promote Arguta and Glabra to sections? De Jong raised them, like most of his 1994 series to sectional level in 2002.** ITS-wise both lineages are still relatively close to the Acer common ancestor (Grimm et al. 2006, figs 2, 4–5) but definitely not sisters, i.e. already ITS data rejected de Jong's (1994) sect. Glabra s.l. Moreover, the North American (the only non-Chinese species included in Yu et al. 2022) A. glabrum has a much different plastid signature than its suggested morphology-wise, de Jong 1994) East Asian sisters (Renner et al. 2008): plastid-wise they. Unsurprisingly, the deep splits in their plastids point to a time before the modern-day lineages sorted and collected themselves (→ Scientia-ex-machina: explicit biogeographic inferences and the phylogenomic age).
* The curse of impact: a just-bad Big Data phylogenomic analysis based on pre-labelled individuals of unknown provenance, a study which require no brains, no field research, just hands and CPU time, gets you in the Q1-journals (Yu et al. 2022). A much needed, well-sampled and determined in the field, hands-on-coalface all-aspects covered study ends up in Springer-NPG's online dump.
** Miscited as “de Jong (2004)” in Yu et al. (2022), a not uncommon copy&paste error; the original was hard to find (I had no idea it existed either, before stepping over the [wrong] citation in a reference list). A digital version (re-edited) PDF has been put online 2019 by the Maple Society. Maybe their homepage is not accessible from behind the Big Internet Wall?
Novelety, where are thou?
How novel are the rest of the results when adding “... [new] complete chloroplast genome sequences of five Acer species and compare them with those of 43 published Acer species...”? The first of these much better complete plastome trees (Wang et al. 2020) was a near-idental replica of our 2008 tree pruned to Chinese species (hence, losing all the interesting bits: Are complete plastome trees always better? Maples, for instance). And the new one …
 |
| Our 2008 oligogene tree in comparsion to later complete plastome studies of Wang et al. (2020) and Yu et al. (2022). Green, branches and tips included in the phylogenomic trees, bold font, tips included in Wang et al. (2020) and retained in Yu et al. (2022); orange, non-Chinese species not included in the phylogenomic trees. Blue, sections fide de Jong (2002), typically recovered as plastid clades; purple, species of sects Spicata and Parviflora have two different plastomes; as well as the Himalayan species of sect. Acer and the assumedly autotetraploid A. pseudoplatanus (see Scientia-ex-machina… for further details on the geographic history of maples imprinted in their plastomes). |
… confirms it even more.
Why is it so hard to just write, e.g.: "Using complete chloroplast plastomes, we recovered a topology in large agreement with that of Renner et al. (2008) but unambiguous branch support"? Maybe one can't, because then it wouldn't be novel enough for a Q1-journal like Frontiers in Genetics?
The “…5 new … 43 published Acer species…” include three non-Chinese ones. What can this possibly tell you about phylogenetic or biogeographic (plastomes!) relationships in a genus that roots in the latest Cretaceous and Paleocene of the High-Arctic and has been circum-northern hemispheric since then?. Activate brains, science people!
Phylogenomic industry-standard: poor data control
"But what about the discrepancies (red branches and stippled lines in the pic above) to Renner et al. (2008)", you may ask. Well, one wouldn't highlight them because they are hard to explain. In fact, when using one's brain, comfortly placed right behind the open eyes, close to impossible.
- A. caesium subsp. giraldii, the eastern, Chinese subsp. of the only East Asian (Himalayas and east) species of sect. Acer, has an early diverged, pretty unique plastome pulling it away from its western Eurasian and North American sisters. You can take any of the more conserved plastid protein-coding genes to check this out and see for yourself. There's no (evolutionary) way an A. caesium plastome nests in the clade representing the completely (morphologically, nuclear-data- and plastid-marker-wise) unrelated sect. Arguta. Unless it's captured from the latter. Improbable because no Argutas are close enough (geographically and habitat-wise), not today and not in the past. The closest living plastid relative of A. caesium is still A. pilosum (similar niche, further northeast), and possibly the newly described A. yangbiense (sympatric). The latter, placed by its inventors in section Lithocarpa, seems to have indeed a striking similar plastome … and genome (Li et al. 2019)! As one can still see in Wang et al.'s (2020) few-tips tree, but only A. yangbiense remains in place in Yu et al.'s more-tips (2022) tree. Use your grey cells! If something makes no sense, double-check your data!
- Likewise, in Yu et al.'s tree A. cissifolium (sect. Cissifolia) did some profound clade jumping, away from its sister species A. henryi, with which it shares not only a peculiar morphology (de Jong 1994), chemical profile (Delendick 1981, 1982), highly similar plastid marker regions (data used and generated by Renner et al. 2007, 2008) but also its ITS lineage (Grimm et al. 2006) and nuclear gene sets (Li et al. 2019). Mother Nature a lot, so such coherence cannot be accidental, A. cissifolium and A. henryi must be sisters, sharing an, very exclusive to them, common ancestor. An A. cissifolium having a Palmata-type plastome is either an intersectional hybrid or a data fuck-up. There is to date no hard evidence for intersection hybrids in maples, it may be a biological no-go. Leaves the data fuck-up explanation: Interestingly, it jumped the other direction than A. caesium. If I should make a guess: Yu et al. mixed up data on A. caesium (F plastome, falling in a B-plastome clade) and A. cissifolium (B plastome, moving into the C-plastome clade, which is the typical plastome of sect. Acer to which A. caesium belongs†). Don't ignore earlier work: if you find something severly at odds, triple-check your data!!
- In our 2008 tree, A. buergerianum (sect. Pentaphylla) came as sister of A. oblongum (same section). Same thing in any other study. Both are Chinese species that can be a little hard to distinguish unless being prototypical, and belong to a quite diffuse species complex with many intermediate forms. See for example the species descriptions and taxonomic discussions in Flora of China (FoC; Xu et al. 2008, de Jong being a co-author; online open access), discerning between sect. Oblonga, not recognised by de Jong (2002), and Pentaphylla in a narrower sense. In Wang et al. (2020), material labelled as “A. buergerianum subsp. ningpoense” – according to FoC a synonym for A. buergerianum var. buergerianum††: A. buergerianum sensu strictissimo – nested, however, deep inside the Palmata clade. Clear indication for mislabelling/ misidentification, unless all earlier studies, and taxonomists, got it awfully wrong (despite having being right in pretty much every other case). Having not to fear any taxonomic scrutiny during Q1-journal (allegedly expert, in phylogenomics that is, not the organism studied) peer review, Yu et al. (2022) kept the mislabelled, since misplaced, tip in their data set and tree. Another problem is that species placed in sect. Oblonga can be notoriously difficult to distinguish from certain species of sect. Palmata, belonging to a distant-cousin lineage (Grimm et al. 2006; Renner et al. 2008; Li et al. 2019). By adding another possibly misdetermined/ labelled Palmata species, A. sino-oblongum, literally: the ‘Chinese A. oblongum’, a species somehow similar but not related to A. oblongum (FoC), Yu et al. (2022) managed to completely mess up the two sections, finely separated in our 2008 plastid “fragment” tree and alternative complete plastome trees, equally undersampled but at least not restricted to Chinese species (Areces-Berazain et al. 2020).
† Which, if really the case, tells us something about the evolutionary relationship between C- and F-plastomes. If mixing bits of F into a non-F plastome gives you a C plastome, this indicates that – in contrast to what we see in plastid trees – the C and F plastomes might share a (notably deep) quasi-inclusive common origin. In other words, A. caesium didn't pick up the F plastome (or the LCA of the rest of sect. Acer the C plastome), but it's a simple sorting phenomenon: the F plastome only survived in a remote area, the Himalayan corridor. Because of the deep divergence and the genetic drift that affected both possible sister lineages in the 50 or so million years that followed, this signal has became obscured in all-in plastid trees, and local LBA (long-branch attraction) increasingly pulls the uniqe F plastome away from the widely shared across Eurasia and imported into North America, C plastomes. Analysing the complete plastomes in-depth, e.g. by establishing gene support for alternative backbone splits and establish ancestor-descendant relationships in low-divergent, conserved gene regions, would allow digging out such a signal. Unfortunately, exploratory data analysis is not a requirement in any phylogenetic (let alone phylogenomic) study; it's just a hobby of heretics like me. Nutballs who want to understand their trees, not just describe them in words. Who, more often than not, had to explain to editors and convince “expert” reviewers why doing all this fuzz at all.
†† I find it very puzzling that even P.R.Chinese editors preferring P.R.C.-based reviewers for P.R.C.-centred research don't bother to have the authors at least look up the currently valid species names in the P.R.C.'s taxonomic standard work, the Flora of China, which is open access (and very easy to access being part of e-Floras initiative). While we had to battle from time-to-time reviewers when not following e.g. the Flora Europaea or Kew's checklists for a good (and argued) reason. I guess, quick-publication and -citation is more important in phylogenomic analyses than taxonomic scrutiny. For everyone else, who wants to use the currently right names but has no idea about the organism studied, a few essential links: IPNI–author names for species; Kew's checklists: Plants of the World Online, Tropicos–fusing taxonomic and geographic information; e-Floras service.
 |
| Close-up on the messy clades in Yu et al.'s (2022) tree. Hard to say what is a genuine signal and not just a data-/branching-/labelling artefact. Annotated in the centre: the plastome lineages as defined by Renner et al. (2008). |
The generally poor taxonomic control in phylogenomic studies like that of Yu et al. (2022) makes it impossible to judge, whether putatively interesting placements are genuine or not. One such interesting placement would be that two more members of the C-plastomes-carrying Pentaphylla-Trifoliata lineage (A. paxii, “A. cinnamomifolium” = A. coriaceifolium in FoC; both sect. Oblonga fide FoC) carry Palmata (D) plastomes. If genuine,
- this would point to (relatively) recent ‘chloroplast capture’ (in a broad sense, i.e. involving inter-sectional hybridisation/ reticulation [Wp-stub]) in the mountains of China. Incomplete lineage sorting is unlikely, given that these two (super-)sectional lineages are nuclear-wise most distant to each other; or
- that (non-palmate!) Palmata species have been misplaced in section Oblonga by systematicists! While morphology has always been highly diagnostic in maples showing a high phylogenetic sorting (starting with Ackerly & Donoghue 1998 using limited ITS data and persisting until Li et al. 2019, using “500+ loci”), a recent example shows that this is not always the case: Acer yangbiense has been recently described as new species from S.W. China (Chen et al. 2003) in sect. Lithocarpa (nuclear ‘platanoid cluster’, D plastome) but its genetics place it in sect. Acer as sister to the distinct Asian A. caesium sublineage (nuclear ‘aceroid cluster’, F plastome).
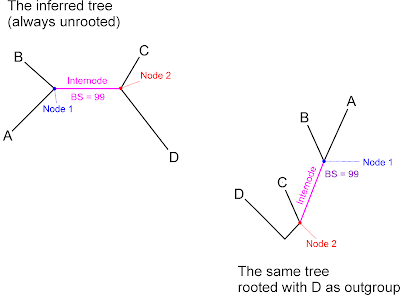
Never growing tired to point out in case you haven't read any other of my posts or papers (everyone else, please skip the following): It's not “node” support, Yu et al. (2022), pp. 3, 7, but, as stated in their fig. 4 (copy&paste from two sources?): “…The numbers above the branches [correct!] are the posterior probabilities of BI and bootstrap values of ML and MP. Asterisks represent nodes [wrong!] with maximal support values in all methods.” but branch support!
We infer branch support by counting the taxon bipartitions in a tree sample, e.g. the boostrap pseudoreplicates or the Bayesian sampled topologies. A taxon bipartition is literally the whole taxon set split into two (‘bi…’) parts (‘…partition’). In a standard phylogenetic tree (i.e. 1-dimensional dichotomous stick graph), each bipartition is represented by a branch. A node is the connecting point of three branches (in a standard dichotomous phylogenetic tree). A branch, also called internode, connects two nodes; it lies between between them, hence the name. I.e. the inferred branch support value can be applied to two different nodes, and we can draw from three adjacent branch supports for each (internal) node! We choose the node when rooting the inferred tree after analysis, which is a purely graphical manipulation. We thus only interpret the branch support as node support under the explicit assumption our root is correct. Which, we never can be sure of. So, just to be on the safe side, report what you inferred: branch support.
Important to keep in mind is that the NEWICK format doesn't define taxon bipartions but sister tip pairs (sister clades), hence, any NEWICK-coded tree is implicitly rooted. We save the inferred unrooted tree as a fixed (by defining one tip or a subtree as outgroup) or unfixed (randomly) rooted version. As long as we depict this tree unrooted or don't re-root, we will have no problems: the values will stay at the right place. But when the inferred tree is re-rooted, thus, re-interpreted, tree viewers may move a branch support to one node too far because of this insufficiency of the NEWICK-format (Czech et al. 2017). Which was the reason, already classic RAxML saved two versions of the tree with branch-support, a standard one, and one where the branch support were fixed to their branches by using extra shadow nodes that only connected then two branches but could only be viewed with certain tree viewers such as Dendroscope. Dendroscope is network-compatible, allows for anastomoses in a phylogenetic graph, hence, can handle nodes of different dimensions: nodes at the junction of two, three or more internodes.
NGS nuclear data: Big Data = No Brainer
Equally novel are the highlighted results of the nuclear phylogenomic data published two years earlier (Li et al. 2019).
Our phylogenetic results support the most recent taxonomic treatment of Acer by de Jong with some modifications [as all studies did before, when using nuclear data]; section Pentaphylla may be expanded to include section Trifoliata [= Pentaphylla-Trifoliata clade of Grimm et al. (2006), Renner et al. (2008)], and A. yangbiense may be included in section Lithocarpa [as stated in the paper describing the new species but neither does its plastome match nor do Li et al.'s own data]. Sections Spicata, Negundo, Arguta, and Palmata form a clade [= ‘palmatoid cluster’ in Grimm et al. (2006)] sister to the rest of the genus where sections Glabra and Parviflora comprise the first clade followed by section Macrantha, sections Ginnala, Lithocarpa, Indivisa [albeit ML/BI and MSC trees prefer different alternatives], sections Platanoidea and Macrophylla [≈ ‘platanoid cluster’ in Grimm et al. (2006), now a grade], section Rubra [their Japanese sp. not included, nor their S.E. Asian tropical sister, A. laurinum], section Acer, and section Pentaphylla [= ‘aceroid cluster’ in Grimm et al. (2006), incl. the Pentaphylla-Trifoliata clade]. Monotypic sections Glabra and Macrophylla in North America are sister to the Japanese section Parviflora and Eurasian section Platanoidea, respectively [again see Grimm et al. (2006), and the earlier ITS phylogenies referenced also by in Li et al. (2019) at the according places in the text; our ITS studies only pop-up in the introduction—a long grudge Li apparently (still) nurtures; → Pt.2: Trivia].
In short, Li et al.'s “…first well‐resolved phylogeny of Acer based on DNA sequences of over 500 nuclear loci generated using the anchored hybrid enrichment method…” confirmed a lot we inferred based on broadly sampled ITS data, or in their own words: “##...phylogenetic studies of Acer have been conducted since 1998, but none have provided a satisfactory resolution for basal relationships among sections of Acer.”
Hm, personally, I was quite satisfied already 2006 (and very much intrigued by 2008); and my initial satisfaction with our 2006 set of analyses grew when looking at Li et al.'s tree(s).
 |
| Some similarities—green branches; some tolerable refinement—orange branches, still explainable by rogues, incomplete lineage sorting and/or data-inherent shortcomings; some conflicts—red branches, where ITS mutation patterns don't agree with Li et al.'s phylogenomic tree/ coalescent (Li et al. 2019, fig. 1; both alternatives shown, original labelling inconsistencies corrected as far as possible). Central graph: a distance-based neighbour-net we used to explore deep (inter-cluster) relationships in maple ITS (Grimm et al., 2016, fig. 2a), a logic hard-to-grasp for most phylogeneticists that only consider unambiguously supported, trivial-to-interpret clades as phylogenetic information. |
Towards the root, and regarding inter-sectional relationships, there are indeed some notable differences but also strange similarities to our in-depth analysis of mutational trends in the ITS regions:
- Our ‘aceroid cluster’ loses two members, monotypic, genetically and morphologically quite unique sections: Indivisa and Ginnala. However, their exact position apparently differed substantially between the ML/BI-trees and the ASTRAL coalescent. How much, is hard to say, since all branches in this deep part of the tree are extremely short and some may not be fully annotated. You cannot have 100 bootstrap (BS) support for a branch that conflicts with one that received BS>65 in the very same (ASTRAL) analyses.
- Our ‘palmatoid cluster’ remains largely unchanged, only sect. Arguta moves on node away from sect. Palmata closer to Cissifolia-Negundo clade.
- The ‘platanoid cluster’ becomes a grade, a potential paraphyletic group from which the ‘aceroid cluster’ evolved. Mainly due to the placement of sect. Macrantha, moving to a most root-proximal (“basal”) position. Their ITS sequences, showing a deep split represented in Li et al.'s gene sample as well, show nonetheless a clear affinitity with those of sect. Lithocarpa and the Macrophylla-Platanoidea clade. The latter remain grouped but sect. Macrantha is placed outside, sister to all the other sections making up our 2006 ‘aceroid’ and ‘platanoid’ cluster.
- As a general trend, Li et al.'s 500-nuclear-loci trees are less congruent to the plastid trees (2007–2022) than our 2006 ITS trees and networks. Higher resolution or more ‘false positives’?
There's no documentation in the original paper, how signal-rich Li et al.'s (2019) genomic data were, but with 500(+?) genes, you always get a fully resolved tree. The differences between the concatenated data-based ML tree and the coalescent-searching ASTRAL tree linked to short backbone branches can be indicative for low-amplitude signal fuzziness, which invite branching artefacts—‘false positives’. At this taxonomic level, most of the loci will have very little discrimination capacity on their own but since there are so many of them, you always converge to resolved tree (long-known, hence, a classic paper: Delsuc et al. 2005). How reliable such a combined signal/ coalescent tree is, we typically have no idea about.
On the one hand, ML/BI and coalescence inferences use different models. Thus, when they agree (with high support) on certain relationships, they are probably not wrong. Unless the shared assumption of both approaches are violated: that the data is the product of a single ‘true tree’. There are three possibilities to get a high-supported but short backbone branch:
- Differentiation in a few genes strongly support this branch, and the rest cannot tell, strongly oppose it but in an inconsistent fashion, e.g. when you have 100 genes and 2 agree on a branch, and all other 98 prefer a different alternative, both classic trees and MSC tree will give converge to the preferred-by-two topology—not a good indication for holophyly.
- The are a few, but scattered across the whole gene set, consistent and conserved split patterns—Mother Nature dices a lot and likes to mix things up, so, a weak but cross-genome consistent signal is a very good indication for a(n) (inclusive) common origin.
- It's a branching artefact. If 98 of 100 tips in a data set show strong affinities and are collected in high-supported, genetically coherent clades with well-defined deeper (inter-clade) relationships, the remaining 2 may have very little in common, but, not fitting elsewhere, come out as sister taxa—a ‘false positve’. If you have a too distant outgroup, ‘IOBA’ sets in: ingroup-outgroup long-branch attraction, and they will always be sister to the remainder of the ingroup with high branch but no character/gene support.
Very few phylogenomic studies test the signal in their data (see e.g. OTPTI 2019, fig. 3; Walker et al. 2019; and Chen & Schrödl 2022, for workflow proposals/ more-than-usual). What I can say is that in beeches, another widespread extratropical tree genus sharing not a few areas with maples, already 28 nuclear genes suffice to get A fully resolved, but perfectly misleading species tree. What I can also say is, that if you simulate 100 matrices, each with 500 nucleotides, along 100 randomly generated topologies with 10 tips each and then combine the data, you still get branches with moderate to high bootstrap support.
Good, not-so-good and bad clades—a quick-and-simple EDA
We note the extreme shortness of the root-proximal branches in comparison to the sections' roots and the terminal branches. This may reflect a fast ancient radiation (but see their chronogram in fig. 3), which are hard to decipher (also the reason we didn't focus on the backbone in our 2008 paper). The long terminal branches, >2-times the length of the corresponding subtree's internal branches, and >10-times longer than most of the backbone branches indicate that there's a lot of terminal noise in the primary data set, which can invite (local) LBA—long-branch attraction. Such inflated terminal branches either reflect randomly distributed, singleton mutations (NGS data is notoriously noisy) or because of inter-genic conflict due to reticulation in the past: introgressed alleles (as seen in the beeches). There's no fully annotated matrix available, which we would need to properly investigate the gene sample but at least a non-annotated combined, stored as NEXUS-file on DataDryad. Let's take a look at the neighbour-net (NNet) based on Li et al.'s non-annotated 422 kbp nuclear matrix.
 |
| Pretty trivial signal: Green—edge bundles corresponding to branches in Li et al.'s trees; blue—semi-compatible edge bundles; orange—incompatible with the ML/MSC trees; red edge bundle—the A. monspessulanum-A. pseudoplatanus neighbourhood is (to some degree) a missing data artefact (phylogenetically unrepresentative pairwise genetic distances). PoO—point of origin; FAR—fast ancient (Paleogene) radiation. |
Many relationships captured by the ML/BI and MSC trees are signal-wise trivial: they are represented in the NNet as tree-like portions formed by very prominent trunks. We also see that the placement of sects Indivisa and Ginnala hinges on very little signal, possibly few if any at all point mutations. And that there is a lot of incompatible signal within the ‘aceroid cluster’, the possibly most derived group within Acer, where we also find the most conflicts between the Li et al.'s ML/BI and MSC trees. And because Li et al. were sloppy, we also see that this is not (literally) the the matrix Li et al. used for their fig. 1—they obviously mixed up A. hyrcanum (sect. Acer) with A. cappadocicum (sect. Platanoidea) in their DataDryad matrix dump.
What is astonishing is that this uncorrected p distance-based – no model, just counting the differing bases! – planar network captured nearly all branches in Li et al.'s ML/BI tree in the form of neighbourhoods: there are very prominent to tiny edge bundles (green & bold) corresponding to each (near-)unambiguously supported clade in Li et al.'s phylogenomic tree. Which means, the discriminating signal in the data must have a generally low amplitude, and the relationships we can extract are model-independent (in the case of ITS, a model-based pairwise distance matrix will give you a NNet in better fit with the ML tree than when using uncorrected p distances).
There are only three exceptions, clades in Li et al.'s tree without a corresponding neighbourhood.
- Acer monspessulanum is misplaced within sect. Acer. A quick look on the primary data, the pairwise distances, shows that this is a missing data artefact: the pairwise distances of A. monspessulanum to any other tips are not representative.
- The first diverging clade: monotypic sect. Glabra (western N. America) share no neighbourhood with sect. Parviflora (Japan). But the latter shows a quite prominent neighbourhood with the outtaxon and sistergenus of Acer, Dipteronia sinensis, while A. glabrum (sect. Glabra) has no clear affinities at all, which, tree-wise must result in a “basal”, root-proximal placement (sister to the rest of the genus based on ITS data). But since sect. Parviflora are more similiar to the non-‘palmatoids’ than to the ‘palmatoid cluster’, the trees chose root option A (‘palmatoids’ sister to remainder) over root option B (sect. Parviflora sister to remainder). [Histogeographic fun-fact: the two sister or not lineages, representing the first (modern-lineages) radiation, mark the centres of past biodiversity of maples during the Paleogene and most of the Neogene: cross-Beringia; and the east-of-Beringia A. glabrum carries the earliest diverged maple plastome. “Out-of-Asia”? Hmhmhm.]
- Acer circinatum, the only N. American (northern N. America) species of sect. Palmata is genetically clearly distinct from its E. Asian siblings but has a sister, A. japonicum (sic!), in the ML/BI/MSC trees. [Again: highly diverse group, and the earliest diverging intra-sectional lineage is a Japan-N. America pair. “Out-of-Asia”? Just model-please yourself, neontologists!]
The latter is another stark contrast to the ITS data: ITS-wise A. circinatum is cosily embedded in the E. Asians, and the C. Chinese A. erianthum was placed as sister to the remainder of the section. Acer erianthum also carries (together with three other species) the earliest diverged Palmata-unique plastome: A. circinatum is a Palmata offshot sent across Beringia after the (modern members of the) section started to radiate.
Without any critical branch/gene-conflict analyses, we cannot interpret the neighbourhoods further. The next natural step would be to infer a consensus (or super) network based on the individual gene trees.
 |
| Not maples (no paritioning information available) instead the beeches as how-to-do example: supernetwork based on 28 individual ML gene trees (Cardoni et al. 2022, supplementary information; A fully resolved…). |
But since I know the situation in the ITS (beyond the naked graphs), let's dive a bit into the deep or not water. Let's assume that either the one (ML/BI) or other (MSC; if there is inter-gene conflict and incomplete lineage sorting, theoretically, the latter should be preferred—Li et al. didn't) of Li et al.'s topologies is genuine regarding the deep relationships. Under this assumption and following the cladistic philosophy that the observed clades reflect inclusive common origins (holophyly) and define the phylogenetic sequence in which ‘aceroids’ and ‘platanoids’ evolved, their nucleomes must have undergone some pre-sectional reticulation. The ITS of A. carpinifolium (monotypic sect. Indivisa) doesn't go back to a LCA – ‘last common ITS ancestor’ – exclusively shared with sect. Lithocarpa, nor does A. tataricum's (monotypic sect. Ginnala) but one could reconstruct an ITS sequence that would serve all of our original ‘platanoids’ (incl. sect. Macrantha, which is placed much closer to the root) as LCA. Thus, their 35S rDNA's must have been mixed up compared to Li et al.'s nuclear consensus defining who shared an LCA and who didn't. Which is one explanation why ASTRAL and ML/BI place them differently: Like standard concatenated-data-based trees, MSC trees cannot handle reticulate signals: they assume that all inter-gene conflict is the result of incomplete lineage sorting.
Whether reflected or not in an individual gene's geneaology, the alleles were sorted phylogenetically along the same ‘true tree’: the coalescent. And, as obvious from the NNet, if there was reticulation involved, it happened during or just after a phase of fast ancient radiation. If we have past, in case of Acer probably ancient, reticulation and horizontal gene transfer via hybridisation/ introgression, the MSC algorithms will misinterpret these signals. Severly so, why one would need to calculate not a MSC but an MSCN: a multi-species coalescent network (Wen et al. 2018). But that would be near-impossible with such a large tip set. Why I would have told my lads, if I'd have any (plenty of co-authors on Li's paper), to prune it to a minimum set of representatives (one per sectional lineage), and go for it anyway (and, fully netty, stuff it into a real top-tier journal's throat, not one with a lot of papers revealing a much-compromised peer-review bias and politically inflated impact factor such as Journal of Systematics & Evolution).
 |
| How combined and coalescent analyses can mask substantial inter-gene conflict, and why we should watch out for ancestral (‘plesiomorphic’ fide Ole Hennig) gene variants: Jiang et al.'s (2021) 28 nuclear gene data on beech (Fagus). Left—the standard ML tree (bootstrap support above branches; below branches the range of gene-wise support; MSC was identical according to Jiang et al.); right—the colour coded allelic/genomic variation per loci. |
The other possibility is that we look at signal-amplitude branching artefacts: while A. carpinifolium and A. tataricum came out as sister clades in our 2006 ITS tree, in-depth analyses of the ITS failed to produce any concrete evidence for a putatitve direct common origin (holophyly) of both: what brings them together is that neither one fits really (and this applies also to their phenotypes) anywhere else. Accordingly low and ambiguous was the support of an Indivisa-Ginnala clade in the ITS data. Also visible in the NNet using Li et al.'s all-in matrix: the only clearly visible neighbourhood is the one separating sect. Macrantha. This would be the second possible explanation why Li et al.'s ASTRAL and ML/BI analyses placed them in different parts of the trees, albeit with moderate to unambiguous support.
 |
| Butter-bei-de'-Fisch—mapping a relatively conserved ITS2 motif on Li et al.'s unambigously supported ML/BI backbone tree. While there are clear and conserved mutational trends within the lineages, some mutations must have been fixed independently. The same will apply to a yet unknown number of Li et al.'s loci. |
The opposite, the lack of lineage-unique, derived gene variants (alleles), can explain why sect. Macrantha is placed as sister to most other sections. Already their ITS are pretty primitive (sequentially), why we kept them as tips in our 2006 fig. 2, where we used distance-based network to explore the deep relationships in Acer by eliminating all (stronger or strongly) evolved tips. Note that the basic motif I mapped on Li et al.'s tree above (cf. Grimm et al. 2006, figs 4 and 5) has been not been modified in the lineages close(r) (ITS-wise but also with respect to Li et al.'s ML tree, their fig. 1) to the all-Acer common ancestor (olive branches): the ancestral sequence motif coexists with derived variants in sister lineages (sometimes within a section; stippled lines) and across the entire genus. In this case, the NNet pictures us a clear image: both Macrantha sublineages are much more similiar to each other and clearly distinct from everything else. Such coherence is (the only) (quasi-)sufficient criterion for holophyly. Remains to be tested wether that central neighbourhood placing them away from the rest of the ‘aceroids’ and ‘platanoids’ is supported by a good number of nuclear genes.
Also in this case, the data we face (phylogenomic or not) may not be exactly tree-material. A sneak-peak across the nuclear Tellerrand: their plastomes are incompatible as well!

The Ginnala plastome is so unique, it's just impossible to place (even with complete plastome data as we will see in pt. 2), and belongs somewhere in the netherparts of the ABC group. This plastid crown group of maples includes the plastomes shared by ±distant cousins according to Li et al.'s “first fully resolved Acer phylogeny”: Macrantha-Platanoidea (A plastome), Arguta-Cissifolia (B plastome), and Acer-Pentaphylla-Trifoliata (C plastome).
A molecular-backed classification of genus Acer
The all-in neighbour-net also shows that the mid-branches in Li et al. (2019) nuclear-phylogenomic trees are not data- or method artefacts, they are signal-wise trivial. Members of the currently accepted sections are characterised in the NNet by a much higher within-clade similarity than between-clades: they are genetically highly coherent, resulting in well-defined neighbourhoods → a strong indication of holophyly, inclusive common origin. These neighbourhoods also sort finely per morphological defined groups and are congruent to what we found using 606 ITS clones and a more comprehensive species sample (Grimm et al. 2006). Mother Nature dices a lot, coincidental fits are possible but not probable. It's a valid assumption that the currently recognised sections of Acer (de Jong 2002) are (today) holophyletic, the exception is sect. Pentaphylla (incl. sect. Oblonga; Xu et al. 2008), which may be paraphyletic to sect. Trifoliata. It's further obvious from Li et al.'s data (and our earlier ITS data) that the monotypic, few species sections, should not be included in anything else: their few or single species are genetically nigh-different from the members of the larger clades. Being cladists, Li et al. didn't bother to comment on this coherence and only last minute dared to suggest modifications to de Jong's classification – moving A. yangbiense from sect. Lithocarpa to Acer, but not formally and forgot to update the abstract – but using the heatmap behind the NNet, sorted phylogenetically, one can already visually objectivise at which level one should pin the label "section".
 |
| Input: a phylogenetically sorted heat map of genetic (quasi-genomic) pairwise distances + a well-hung systematic concept (de Jong 2002). Output: an objectivised sectional classification for Acer. Number of species after de Jong (2002, table 3), adapted with respect to deep-sampled intra-/inter-species data (cf. Grimm et al. 2016, 2017; Grimm & Denk, 2014; Yang et al. 2022; genebank data on sects Macrantha and Palmata). |
Pretty straightforward, innit? Sorting the overall divergence patterns following the results of the phylogenetic inferences (Li et al.'s ML/BI and MSC trees; my quick-and-dirty NNet), and then just infer the maximual intra-section – following de Jong's (2002) systematic concept – and minimal inter-section pairwise genetic distances to establish each section- (series-)clade's coherence, the molecular recognisability of the systematic units.

And then tweak it (visually) using a point of reference, e.g. the highest intra-sectional pairwise difference in a putatively holophyletic but diverse section-clade: sect. Acer.
- Raising ser. Negundo to section-level is a no brainer, given how genetically distinct (nuclear-, and even more plastid-wise) it is from its sister-clade, ser. Cissifolia. Currently monotypic but morphologically diverse, in-depth genetic analysis have a high probability of identifying (pseudo)cryptic species.
- Ditto for splitting de Jong's sect. Parviflora into two monotypic sections by raising its series.
- Despite its relatively low coherence, one wouldn't raise any of the series of sect. Acer and tear it apart (cf. Grimm et al. 2007). But one should keep in mind that this section (together with the next) is the most diverse one in the genus in absolute terms. It number of species (10 listed in de Jong 2002) is currently much underestimated because of too lumpy taxonomic concepts in the Flora Europaea and Flora of North America (again cf. Grimm et al. 2007; and the NNet/heatmap above). At this point, with all the available molecular data in mind, this section can be subdivided into a number of series, which, genetically, show a near-section level diversity:
- New Himalayan series including A. caesium, A. giraldii, and A. yangbiense (moved from sect. Lithocarpa); nuclear-wise most distinct to the rest of the section and characterised by F-type plastomes.
- Monotypic ser. Acer, including only A. pseudoplatanus, the genus' type species; nuclear-wise closely related to the next series but with a very ancient (Holartic) plastome (H plastome)
- New series including the western Eurasian relatives of A. pseudoplatanus with the lineage-typical C plastomes: A. heldreichii, A. trautvetteri, A. velutinum
- Acer core group including 10+ species in western Eurasia (A. opalus s.l., A. monspessulanum and A. hyrcanum species aggregates) and at least two species (A. grandidentatum, A. saccharum species aggregate), de Jong (2002) lists for ser. Monspessulana and Saccharodendron. They all have C plastomes. If to be subdivided further, continental splitting maybe tempting but cladistically tricky (not a problem for me, I'm an evolutionary biologist, not a cladist).
- Equally diverse is sect. "Pentaphylla s.l." (or sect. Trifoliata, whatever has priority according to the Code; "Trifoliata" was already used by Pax 1885–1886, but "Pentaphylla" was unknown to him) including all species of the C-plastomes carrying Pentaphylla-Trifoliata clade; a clade consistently recovered with high support no matter which data has been used. De Jong's (2002) series appear to be coherent but so far too little consistent data are available to properly circumscribe ser. Trifida. The later added sect. Oblonga (Xu et al. 2008, FoC) appears to be a mess, most of its species seem to belong to an emended ser. Pentaphylla or ser. Trifida, or form a fifth series in this diverse section-clade. A critical question is also whether the reports of Palmata-like D plastomes in species of Trifida-Oblonga are genuine or not. If they are, one should ponder the possibility of formalising a notho-series.
All (could have been) settled. Pity only, Li et al. didn't include all candidates. They missed the only fully tropical maple, A. laurinum (mono- or bitypic sect. Hyptiocarpa, sister of or to be included in sect. Rubra); and adding one of the two species of sect. Pubescentia (A. pilosum, A. pentapomicum); and testing A. wardiana (monotypic sect. Wardiana, or just another member of sect. Macrantha). In 2006–2008, we were able to “satisfy” two of those. ITS-wise Hyptiocarpa and Pubescentia should remain sections.
Regarding the overall intra-sectional biodiversity, it's paramount to realise that the number of (accepted) species is a poor measure (generally so in the case of arboscent, extra-tropical lineages, see e.g. oaks and beeches): the most species-rich sects Palmata and Macrantha (East Asian, of course, but each with exactly one bridgehead in North America! 41 and 21 spp. in de Jong 2002) are about as diverse as sect. Platanoidea (13 spp. in de Jong 2002; clearly undertaxonomised, cf. Grimm & Denk 2014; Yang et al. 2022) and less diverse as the sister sects Acer and Pentaphylla s.l.
But I'd be very careful in drawing any further conclusions about inter-species, intra-sectional relationships from any phylogenomic data generated so far. Note that at this level, the NNet becomes more boxy and fans replace trunks. Much more in-depth analysis would be needed regarding the use of Li et al.'s phylogenomic data to “…explore the implications of the robust phylogeny for Acer systematics and biogeography.” (and even more, in the case of Yu et al.'s)
- For the former, Acer systematics, the ITS did already do the trick, and there's nothing fundamental Li et al.'s 500 nuclear loci added other than providing higher support for the transcontinental sects Spicata (much higher) and Negundo (bit higher), and for keeping A. caesium (ITS-pattern-wise and morphologically obvious) and adding the newly described A. yangbiense (no ITS data) in sect. Acer (in contrast to what Li et al. wrote in their abstract but fitting what they wrote in the rest of the paper). I bet that to place a species not covered by us in 2006 but included in Li et al.'s data set within one of the (holophyletic as-far-as naturally possible) sections, a dozen of well-selected ITS basepairs still will tell you more than tenths or even hundreds of Li et al.'s nuclear loci.
- And the for the latter, biogeography, one would need to include the fossil record – a standard line at the end of any phylogenetic paper on Acer published in and after 2006, but no one has the hands, time or expertise to do it – and explicitly incorporate the conflicting signal from the plastomes (see the final, 3rd part of Big Data = no Brain?)
But first, let's get a bit lost in the detail, the inconsistencies and conflict in the fully resolved maple tree's leaves: Part 2: Digging deeper
Cited papers (1st and 2nd part)
Areces-Berazain F, Wang Y, Hinsinger DD, Strijk JS. 2020. Plastome comparative genomics in maples resolves the infrageneric backbone relationships. PeerJ 8:e9483.
Cardoni S, Piredda R, Denk T, …, Simeone MC. 2022. 5S-IGS rDNA in wind-pollinated trees (Fagus L.) encapsulates 55 million years of reticulate evolution and hybrid origins of modern species. The Plant Journal 109:909–926.
Chen Y, Yang Q, Zhu G. 2003. Acer yangbiense (Aceraceae), a new species from Yunnan, China. Novon 13:296–299.
Chen Z, Schrödl M. 2022. How many single-copy orthologous genes from whole genomes reveal deep gastropod relationships? PeerJ 10:e13285.
Delendick TJ. 1981. A Systematic Review of the Aceraceae. Ph.D. City University of New York.
Delendick TJ. 1982. Infrageneric nomenclature in Acer (Aceraceae). Brittonia 34:81–84.
Delsuc F, Brinkmann H, Philippe H. 2005. Phylogenomics and the reconstruction of the tree of live. Nature Reviews Genetics 6:361–375.
van Gelderen DM, de Jong PC, Oterdoom HJ. 1994. Maples of the World. Portland, OR: Timber Press.
Grimm GW. 2003. Tracing the mode and speed of intrageneric evolution - a case study of genus Acer L. and Fagus L. D.Sc. Eberhard-Karls University. Open access.
Grimm GW, Renner SS, Stamatakis A, Hemleben V. 2006. A nuclear ribosomal DNA phylogeny of Acer inferred with maximum likelihood, splits graphs, and motif analyses of 606 sequences. Evolutionary Bioinformatics 2:279–294.
Grimm GW, Denk T, Hemleben V. 2007. Evolutionary history and systematic of Acer section Acer - a case study of low-level phylogenetics. Plant Systematics and Evolution 267:215-253.
Grimm GW, Denk T. 2014. The Colchic region as refuge for relict tree lineages: cryptic speciation in field maples. Turkish Journal of Botany 38:1050–1066. [PDF]
Grimm GW, Kapli P, Bomfleur B, McLoughlin S, Renner SS. 2015. Using more than the oldest fossils: Dating Osmundaceae with the fossilized birth-death process. Systematic Biology 64:396–405.
Holland B, Moulton V. 2003. Consensus networks: A method for visualising incompatibilities in collections of trees. In: Benson G, and Page R, eds. Algorithms in Bioinformatics: Third International Workshop, WABI, Budapest, Hungary. Proceedings. Berlin, Heidelberg, Stuttgart: Springer Verlag, 165–176.
Jiang L, Bao Q, He W, …, Zhang Z-Y. 2021. Phylogeny and biogeography of Fagus (Fagaceae) based on 28 nuclear single/low-copy loci. Journal of Systematics and Evolution doi:10.1111/jse.12695.
de Jong PC. 2002. Worldwide maple diversity. In: Wiegrefe SJ, Angus H, Otis D, and Gregorey P, editors. International Maple Symposion 02. Westonbirt Arboretum and the Royal Agricultural College in Gloucestershire, England: The National Arboretum Westonbirt. p 2-11.
Li J, Stukel M, Bussies P, Skinner K, …, Swenson NG. 2019. Maple phylogeny and biogeography inferred from phylogenomic data. Journal of Systematics and Evolution 57:594–606.
One Thousand Plant Transcriptomes Initiative [OTPTI]. 2019. One thousand plant transcriptomes and the phylogenomics of green plants. Nature 574:679–685.
Pax F. 1885/1886. Monographie der Gattung Acer. Botanisches Jahrbuch 6:287-347; 7:177-263.
Potts AJ, Hedderson TA, Grimm GW. 2014. Constructing phylogenies in the presence of intra-individual site polymorphisms (2ISPs) with a focus on the nuclear ribosomal cistron. Systematic Biology 63:1–16.
Renner SS, Beenken L, Grimm GW, Kocyan A, Ricklefs RE. 2007. The evolution of dioecy, heterodichogamy, and labile sex expression in Acer. Evolution 61:2701–2719.
Renner SS, Grimm GW, Schneeweiss GM, Stuessy TF, Ricklefs RE. 2008. Rooting and dating maples (Acer) with an uncorrelated-rates molecular clock: Implications for North American/Asian disjunctions. Systematic Biology 57:795–808.
Schliep K, Potts AJ, Morrison DA, Grimm GW. 2017. Intertwining phylogenetic trees and networks. Methods in Ecology and Evolution 8:1212–1220.
Stamatakis A, Göker M, Grimm GW. 2010. Maximum likelihood analysis of 3,490 rbcL sequences: Scalability of comprehensive inference versus group-specific taxon sampling. Evolutionary Bioinformatics 6:73–90.
Walker JF, Walker-Hale N, Vargas OM, Larson DA, Stull GW. 2019. Characterizing gene tree conflict in plastome-inferred phylogenies. PeerJ 7:e7747.
Wang W, Chen S, Zhang X. 2020. Complete plastomes of 17 species of maples (Sapindaceae: Acer): comparative analyses and phylogenomic implications. Plant Systematics and Evolution 306:61.
Wen D, Yu Y, Zhu Y, Nakhleh L. 2018. Inferring phylogenetic networks using PhyloNet. Systematic Biology 67:735–740. [Software]
Yang R, Deng Y-W, Liu Y, Zhao J, Bao L, Ge J-P, Wang H-F. 2022. Genetic structure and trait variation within a maple hybrid zone underscore North China as an overlooked diversity hotspot. Scientific Reports 12:13949.
Xu T, Chen Y, de Jong PC, Oterdoom HJ, Chang C-S. 2008. Acer Linnaeus, Sp. Pl. 2: 1054. 1753. In: Wu Z, Raven PH, and Hong D, eds. Flora of China, Vol 11: Oxalidaceae through Aceraceae. Beijing, St. Louis: Missouri Botanical Garden Press, 516–553.
Yu T, Gao J, Huang B-H, Dayananda B, Ma W-B, Zhang Y-Y, Liao P-C, Li J-Q. 2020. Comparative plastome analyses and phylogenetic applications of the Acer Section Platanoidea. Forests [an MDPI journal] 11:462.
Yu T, Gao J, Liao P-C, Li J-Q, Ma W-B. 2022. Insights into comparative analyses and phylogenomic implications of Acer (Sapindaceae) inferred from complete chloroplast genomes. Frontiers in Genetics 12:791628.
No comments:
Post a Comment
Enter your comment ...